I firstly want to acknowledge the work of Mark Round and Linux iostat monitoring with Cacti. The following work was inspired and based on the ideas found in Mark’s post.
My main objective when I started looking into disk monitoring was to get some similar stats into Cacti for Linux that can be found with the Windows PerfMon utility. I found Mark’s post and didn’t quite like the way it used cron to collect its statistics, and wanted something that I could easily add to snmpd.conf without needing to change much more. I was also keen on obtaining the mount point data for each partition as looking at “cciss/c0d0p3” doesn’t mean as much to management (and sometimes to me) and hopefully “/home” does.
So I wrote a script which uses the output from “df -l”, “vmstat -d”, “iostat -dk”, “iostat -xdk” to produce the results I wanted. This script only looks at the individual partition on the disk. Some of the stats don’t work with Software RAID, and some stats are missing for some older versions of the kernel when used with a HP Hardware RAID card (this is all I have tested with). These are the results.
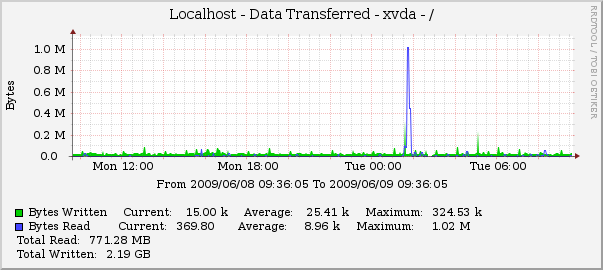
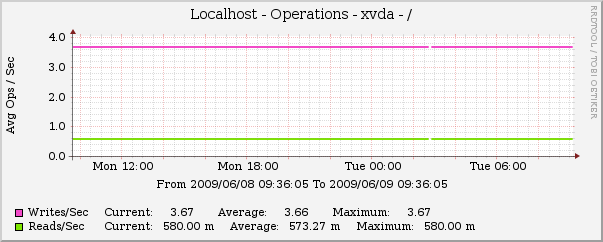
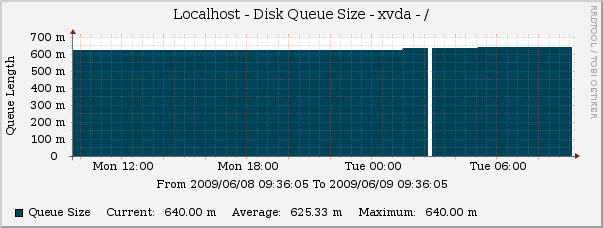
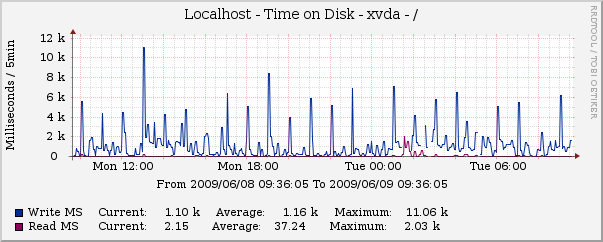
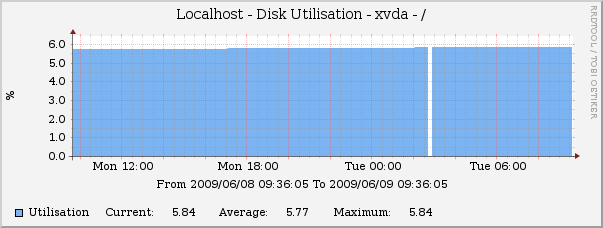
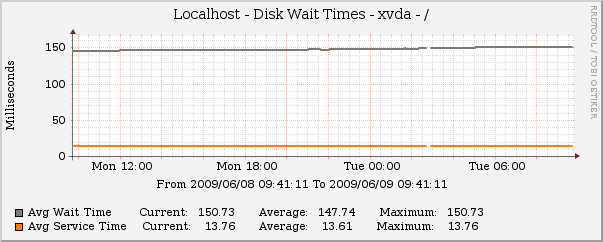
Requirements:
- sysstat package
- Net-SNMP
- Tie::IxHash perl module
- Cacti (Ver 0.8.7d minimum)
Installation:
- Make sure you have the requirements installed.
Tie::IxHash comes as a package on both Debian/Ubuntu and OpenSUSE and at the very least you could install it using CPAN.
Sysstat also should come prepackaged for most Linux Distros. - Copy the “disk_stats.xml” file from the archive into the “resource/snmp_queries” folder of your Cacti installation.
- Copy the “disk_stats.pl” file to your “/usr/local/bin” directory and run “chmod +x /usr/local/bin/disk_stats.pl“.
- Edit your “snmpd.conf” file and add the following line “pass .1.3.6.1.4.1.2021.51 /usr/bin/perl /usr/local/bin/disk_stats.pl” (If that OID conflicts with another OID on your system you need to change the value used both in your snmpd.conf file and in the disk_stats.pl file. You will need to restart SNMPD after this change.
- Import the “cacti_data_query_snmp_-_disk_stats.xml” file into your Cacti installation using the “Import Templates” menu option.
You should now be able to open a device and add the “SNMP – Disk Stats” in the “Associated Data Queries” section.
11 replies on “Monitoring Linux Disk Statistics with Cacti”
Hi,
Do you have also a version for redhat 5 or centos 5?
Looks like that the output of vmstat is different, especially if LVM is involved
Thank you a lot
Enrico
@Enrico
This is something I will be looking into soon, just haven’t had a lot of time for my personal tech work lately.
It would be helpful if you could post a sample of your Centos/RHEL vmstat output.
Cheers,
Jon
If I run /usr/local/bin/disk_stats.pl is it supposed to output anything? I’m not getting any SNMP items or rows, and running /usr/local/bin/disk_stats.pl directly outputs nothing.
Hi,
I don’t seem to be able to get it working.
I tried running snmpd in foreground and got this when I clicked verbose query from Cacti:
ucd-snmp/pass: pass-running: /usr/bin/perl /usr/local/bin/disk_stats.pl -n .1.3.6.1.4.1.2021.51
But it returns another OID, .1.3.6.1.4.1.2021.100.1.0 meaning it’s not generating the subtree. I got the same result by running MIB Browser.
If I manually run the command from the snmpd log, I get:
/usr/bin/perl /usr/local/bin/disk_stats.pl -n .1.3.6.1.4.1.2021.51
getnextoid(.1.3.6.1.4.1.2021.51): returning .1.3.6.1.4.1.2021.51.1.1
Fetching oid : .1.3.6.1.4.1.2021.51.1.1
(I’ve enabled debugging from the script)
You can contact me on my e-mail if you need any details.
Hello! can you help me with setting of this query???
Hi, this monitor is exactly what im looking for but I’m unable to get it working on Ubuntu 14.04 and cacti 0.8.8b
When i configure it on the Cacti host, i follow all your instructions but I get this error..
+ Running data query [20].
+ Found type = ‘3’ [SNMP Query].
+ Found data query XML file at ‘/usr/share/cacti/site/resource/snmp_queries/disk_stats.xml’
+ XML file parsed ok.
+ missing in XML file, ‘Index Count Changed’ emulated by counting oid_index entries
+ Executing SNMP walk for list of indexes @ ‘.1.3.6.1.4.1.2021.51’ Index Count: 0
+ No SNMP data returned
SNMPd is running
root@aws-dev-c-mon-1:/usr/share/cacti# ps -fea | grep snmp
snmp 11789 1 0 10:32 ? 00:00:00 /usr/sbin/snmpd -Lsd -Lf /dev/null -u snmp -g snmp -I -smux mteTrigger mteTriggerConf -p /var/run/snmpd.pid
root 13280 1230 0 10:40 pts/3 00:00:00 grep –color=auto snmp
When i run the perl script, it does not return any data.
/usr/share/cacti# snmpwalk -c public -v1 10.99.0.240 .1.3.6.1.4.1.2021.51
root@aws-dev-c-mon-1:/usr/share/cacti# /usr/local/bin/disk_stats.pl
Fetching oid :
root@aws-dev-c-mon-1:/usr/share/cacti#
snmpd.conf is configured
# tail /etc/snmp/snmpd.conf
#
# AgentX Sub-agents
#
# Run as an AgentX master agent
master agentx
# Listen for network connections (from localhost)
# rather than the default named socket /var/agentx/master
#agentXSocket tcp:localhost:705
pass .1.3.6.1.4.1.2021.51 /usr/bin/perl /usr/local/bin/disk_stats.pl
Net-snmpd is installed
aptitude search net-snmp
i A libnet-snmp-perl – Script SNMP connections
aptitude search ixhash
id libtie-ixhash-perl – Perl module to order associative arrays
Can you help regarding why I am seeing this problem ?
Thanks in advance, feel free to mail me directly.
The script in its current state will only work for disks which have no partitions (i.e. have their filesystem created directly on the block device).
This is because ‘df -l’ returns:
/dev/sda1
/dev/sdc2
Whereas ‘vmstat’ and the other stats utils return the block device name ‘sda’,’sdc’. Thus, ‘count’ never increments to 4 for any device.
Therefore, for this script to work it needs to strip the partition number from the output of ‘df’:
Line 29:
$dfField[0] =~ s/\/dev\///g;
Needs to be:
$dfField[0] =~ s/\/dev\///g;
$dfField[0] =~ s/[0-9]//g;
(can probably make that into one somehow.)
It is also worth noting that as soon as ‘Data Transferred’ graph type has been added you cannot add any more graphs for said device. Therefore, if you want to add all graph types for a device, ensure ‘Data Transferred’ is the *last* graph you add.
For Ubuntu 16.04 (and probably CentOS 5 etc) here are the correct fields for iostat.
if (exists($data{$ioField[0]})) {
$data{$ioField[0]}{“rs”} = $ioField[3];
$data{$ioField[0]}{“ws”} = $ioField[4];
$data{$ioField[0]}{“avgqu-sz”} = $ioField[8];
$data{$ioField[0]}{“await”} = $ioField[9];
$data{$ioField[0]}{“svctm”} = $ioField[12];
$data{$ioField[0]}{“util”} = $ioField[13];
$data{$ioField[0]}{“count”}++;
}
Even though it takes longer, you don’t really get accurate results from ‘iostat’ in the first response, adding ‘-y 1 1’ to the command will give more accurate results.
I ran into a little trouble when adding “SNMP – Disk Stats” to my device (everything else went fine). Under “status” it mentions success, but with “[0 items, 0 rows]”. When i did a “verbose query” it returned the following:
+ Running data query [13].
+ Found type = ‘3’ [SNMP Query].
+ Found data query XML file at ‘/usr/share/cacti/site/resource/snmp_queries/disk_stats.xml’
+ XML file parsed ok.
+ missing in XML file, ‘Index Count Changed’ emulated by counting oid_index entries
+ Executing SNMP walk for list of indexes @ ‘.1.3.6.1.4.1.2021.51’ Index Count: 0
+ No SNMP data returned
So i’m not exactly sure what’s going on. Any hints you could give me (i’m running the latest cacti on the Bunsenlabs – Debian based – distro?
Thanks,
Karl