I had a failure in one of my Exchange Storage Groups last night and the Storage Group had dismounted itself. However the Information Store service was still running and so were the other three Storage Groups on the server. So that got me to thinking, how do I monitor the individual Storage Groups for failures with Nagios?
The solution involves using the check_nt plugin for Nagios and the Nagios pNSClient for windows, the following may work for any one of the Nagios Windows clients but you will have to test it for yourself.
Firstly the check command (Please click the View Source button in the code windows below to see the whole line)
define command{
  command_name    check_exchange_storage_group
  command_line    $USER1$/check_nt -H $HOSTADDRESS$ -p $USER19$ -w 1 -c 0 -v COUNTER -d SHOWALL -l "\MSExchangeIS Mailbox($ARG1$)Client Logons","$ARG1$ Logons: %.f"
}
$USER19$ on my installation is set to the port that Nagios Client for Windows uses. You will need to modify this to suit your needs.
Next define a Service Template
define service {
        name check_exchange_storage_group
        use base
        check_command check_exchange_storage_group
        register 0
}
Then define the service for each host you want to monitor
define service {
        use check_exchange_storage_group
        service_description Exch Storage Group - First Storage Group
        check_command check_exchange_storage_group!First Storage Group-Mailbox Store (ARCMAIL)
        host_name arcmail
}
The following line is the important part, this is what tells Nagios which storage group to monitor
check_command check_exchange_storage_group!First Storage Group-Mailbox Store (ARCMAIL)
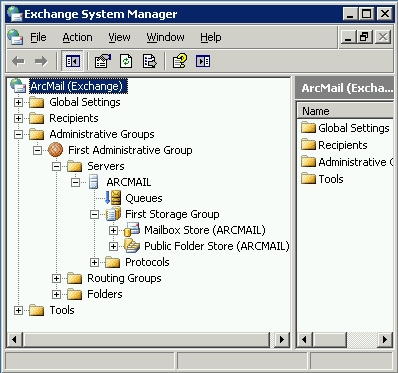
To find out what you need to put after the ! (Exclamation Point) on the check command line check out your Exchange System Manager
And under “Administrative Group -> <<Admin Group Name>> -> Servers -> <<Server Name>>” should be your storage groups (In most cases it should look very similar to above, it will be different if you have a large Exchange installation).
You need to put the names of the Storage Group and Mailbox store together separated by a dash, the Storage Group name required to function for the installation shown above is:
First Storage Group-Mailbox Store (ARCMAIL)
You need to put the whole name in there otherwise the check command will return critical as it cant find the storage group you are trying to monitor.
That should be all that is required to monitor your individual Exchange Storage Groups. A possible caveat is that when some backup software backs up Exchange it will dismount the storage group and hence cause an alarm, if this is the case you will need to put in some exemption times into your Nagios installation.

8 replies on “Monitor Exchange Storage Groups in Nagios”
It does work but not sucessfully. What happen at night, for instance, when no users are logged in?!
any ideas? workarounds?
@lutieri
When a Storage Group is Mounted there is anyway at least one connection, so even if there are no users connected there is one active connection. However when your Exchange server performs maintenance tasks that may disconnect your Storage Group, my recommended workaround for this situation is to use Nagios with Time Periods to stop Nagios checking the Storage Groups during the Exchange Maintenance Window. Hope That Helps.
When implementing this, I get an error in Nagios “Server Port must be an integer”. Any idea what that means? Thx
@Orv Curry
$USER19$ should be set to the port number of the pnsclient running on the windows box. Replace $USER19$ with 6011 and give that a go.
Cheers,
Jon
when implemented, have an UNKNOWN status for this service
what did I miss? pl advise
thank you
Hi again
I have done some re-arangements of arguments of a command line according the “status information” returned by nagios:
# ‘check_exchange_storage_group’ command definition
define command{
command_name check_exchange_storage_group
command_line $USER1$/check_nt -H $HOSTADDRESS$ -v COUNTER -p 6011 -w 1 -c 0 -l “\MSExchangeIS Mailbox($ARG1$)Client Logons”, “$ARG1$ Logons: %.f” -d SHOWALL
}
Now I get CRITICAL status with status information: Connection refused.
Can you help please?
Irina
You have to use double \ after that \MSExchangeIS Mailbox($ARG1$)\Client Logons
With one it works only if you use the console if you use nagios or icinga you should use double \
example:
check_nt_counter!1!0!”\MSExchangeIS Mailbox(First Storage Group-MBX01)\Client Logons”,”%.f Client Logons”
Hi Jon,
Below is my command line :
$USER1$/check_nt -H $HOSTADDRESS$ -s $USER4$ -p 12489 -w 1 -c 0 -v COUNTER -d SHOWALL -l “\MSExchangeIS Mailbox($ARG1$)\Client Logons”,”$ARG1$ Logons: %.f”
Where $USER4$ is my password in NSClient. But I still have a Critical Status altough my $ARG1$ is !First Storage Group-CO Mailbox Store (COSNPREXC3).
Is there anything else I need to check ?
Thanks for your help
Renato